Trading Analytics
Find the Patterns Behind Your Performance.
Go beyond profit and loss. Understand your consistency, risk, trade distribution, and the patterns that shape your results.
01Metrics
Measure More Than Your Win Rate.
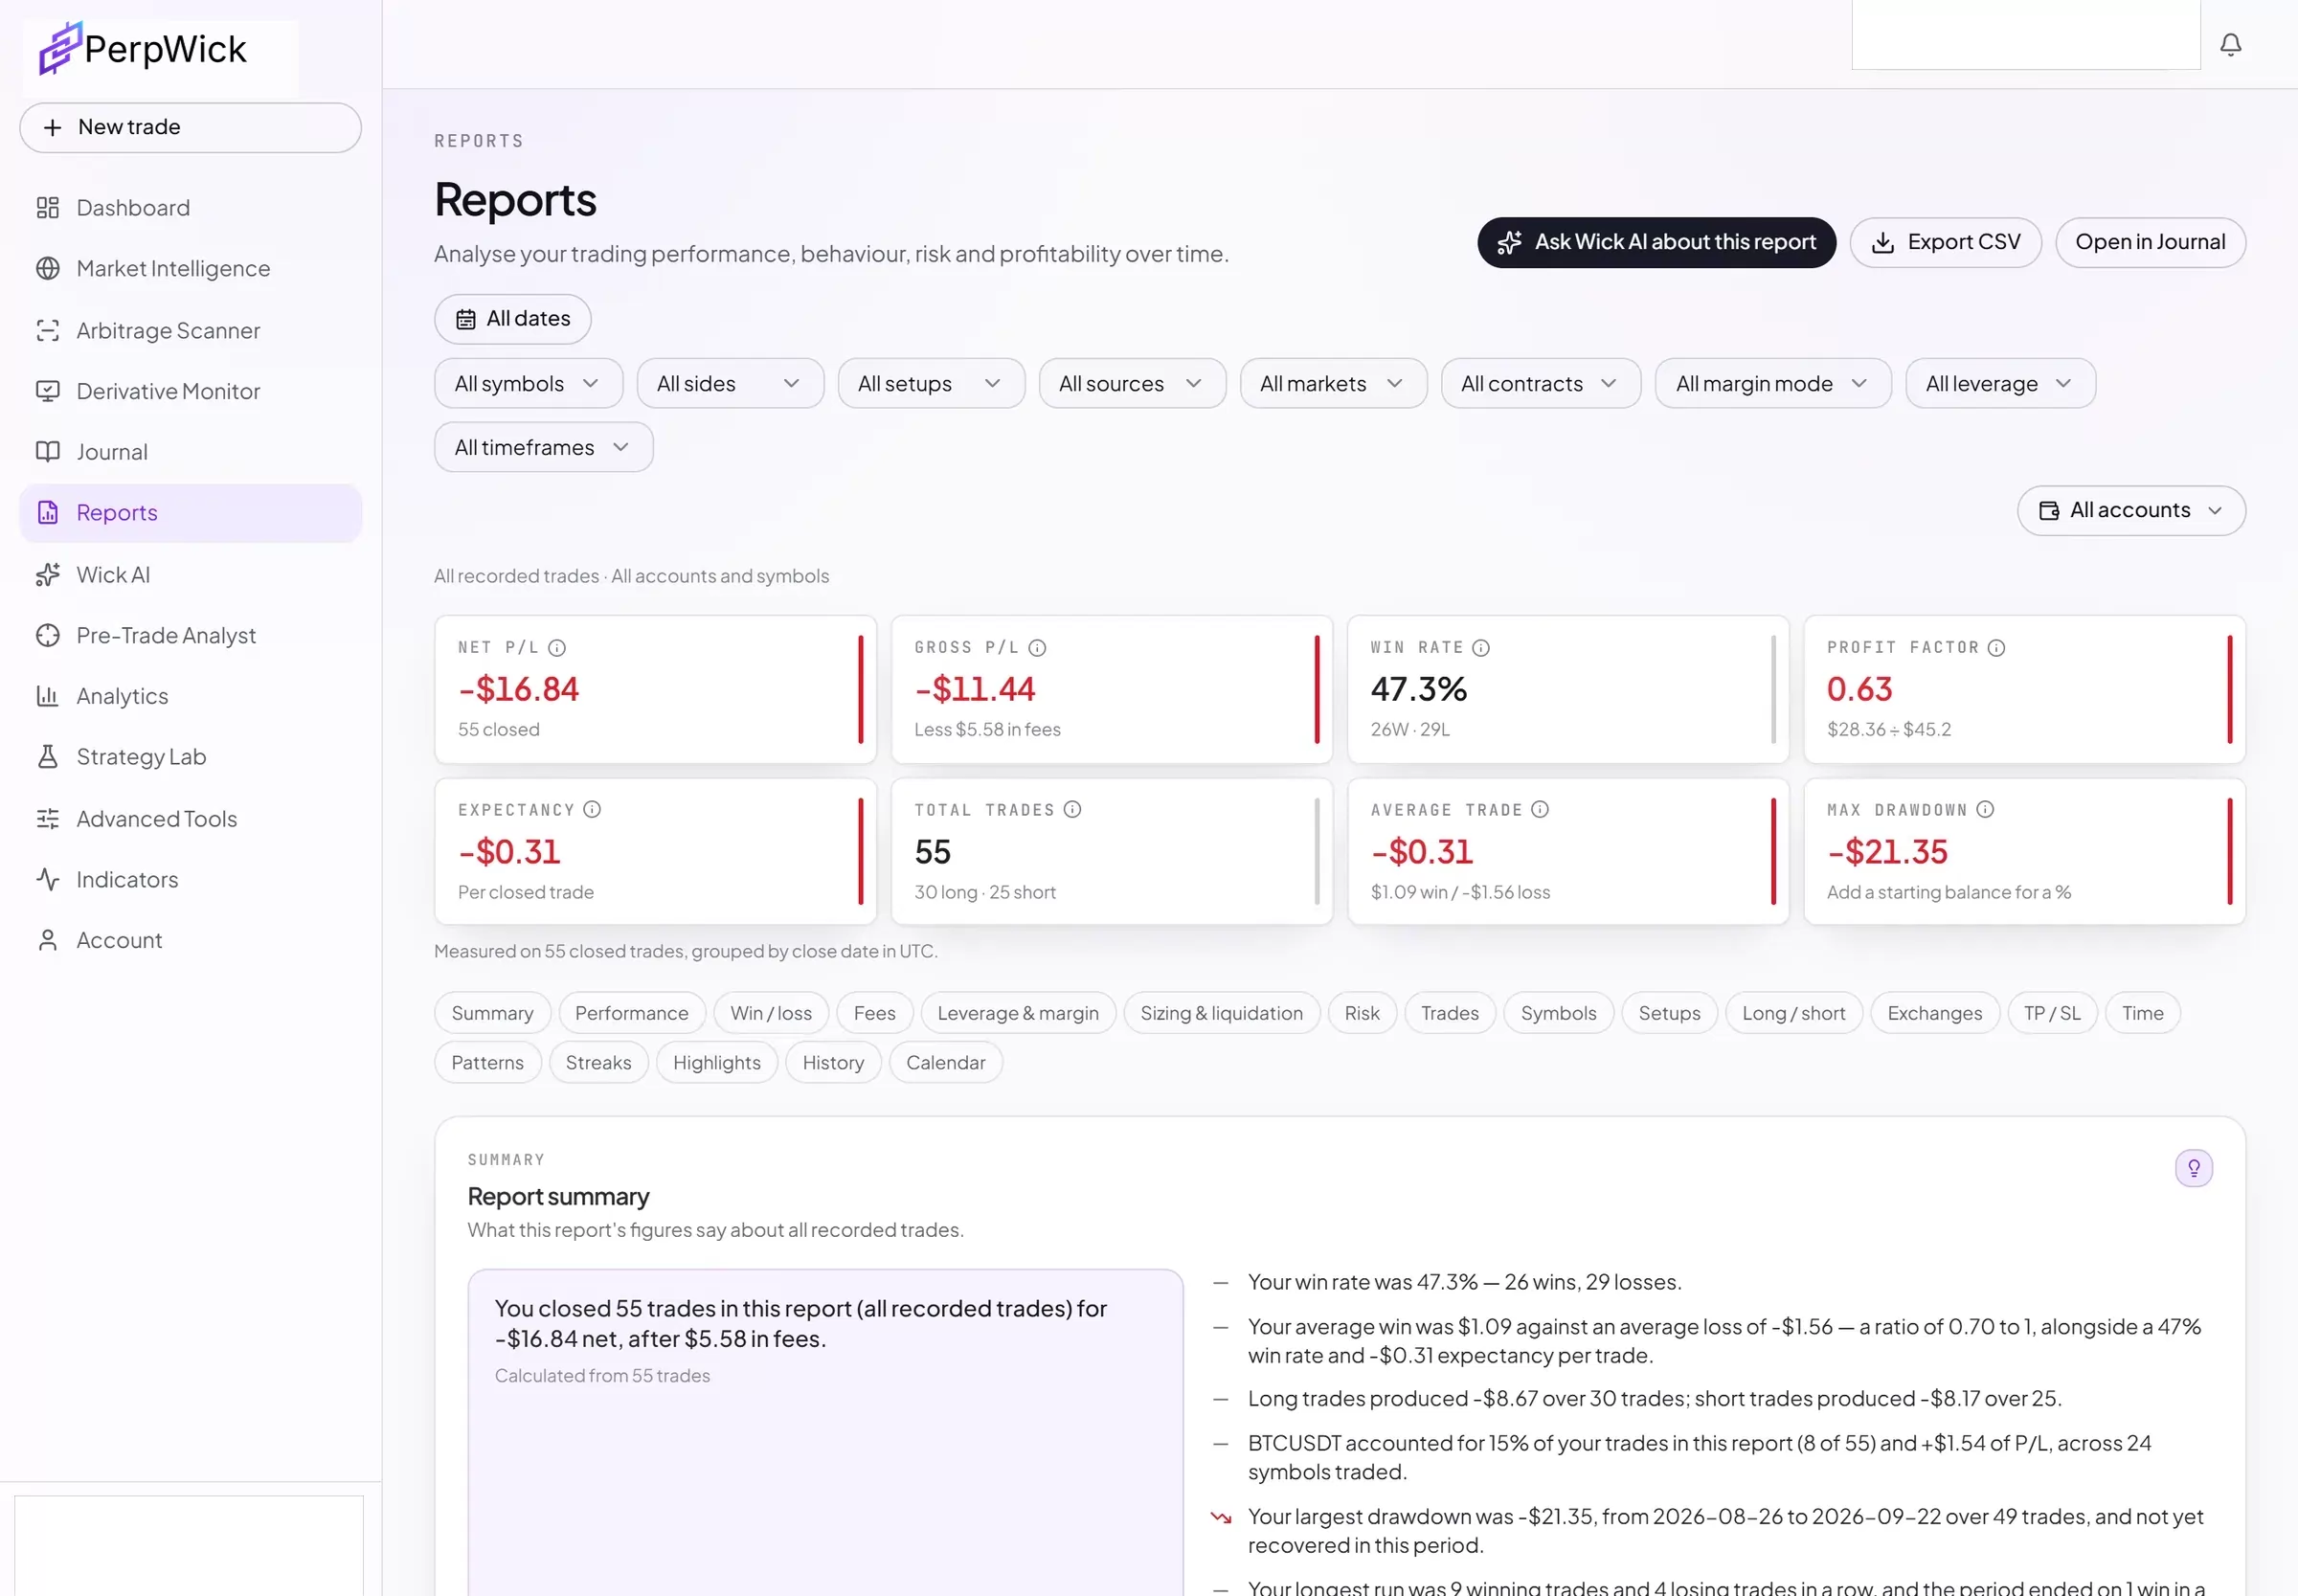
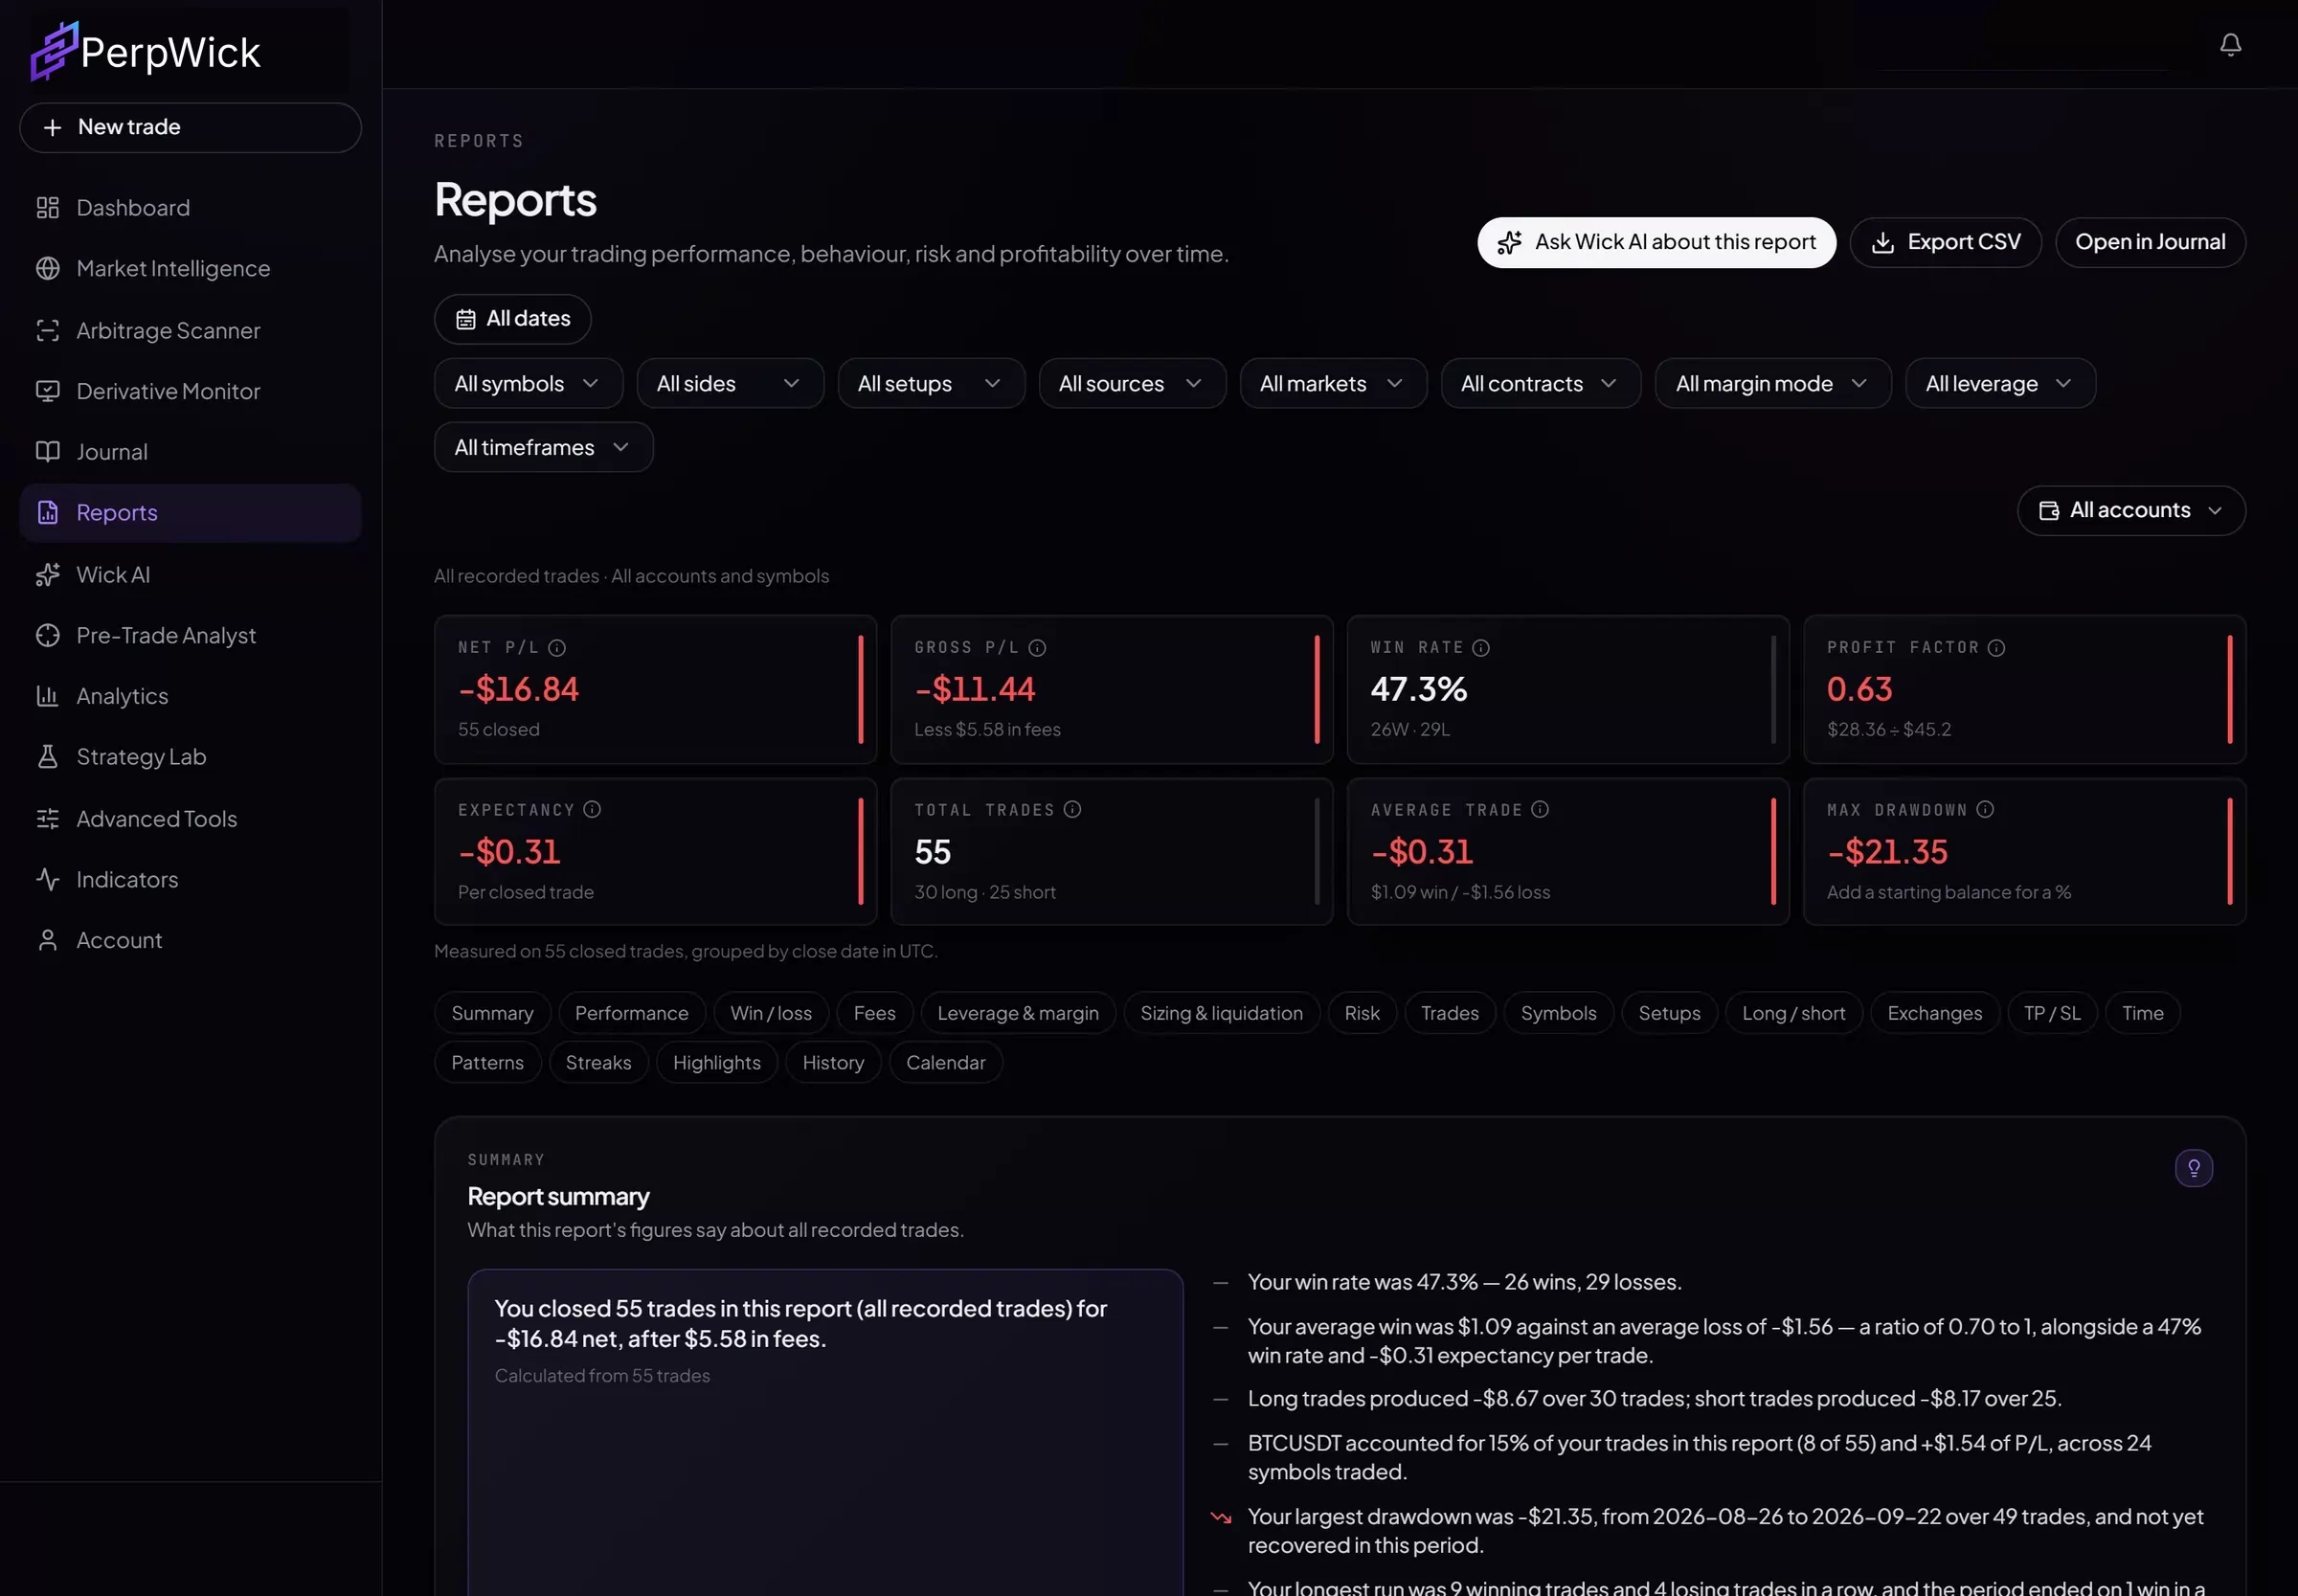
A high win rate with small winners and large losers still loses money. The summary puts the figures that explain a result next to each other, and every one is calculated from the trades you've recorded.
- Total P/L
- Net of the fees you record, with closed and open trade counts.
- Win rate
- Wins, losses and break-evens, counted separately.
- Profit factor
- Gross profit divided by gross loss.
- Expectancy
- Average result per trade, in R and in your currency.
- Total & average R
- From trades with a recorded stop; the sample is shown.
- Average win / loss
- The typical size of a winner against a loser.
- Max drawdown
- Largest fall from peak, and its % with a starting balance.
- Streaks
- Longest winning and losing runs, and the current one.
02Breakdowns
See Where Your Results Come From.
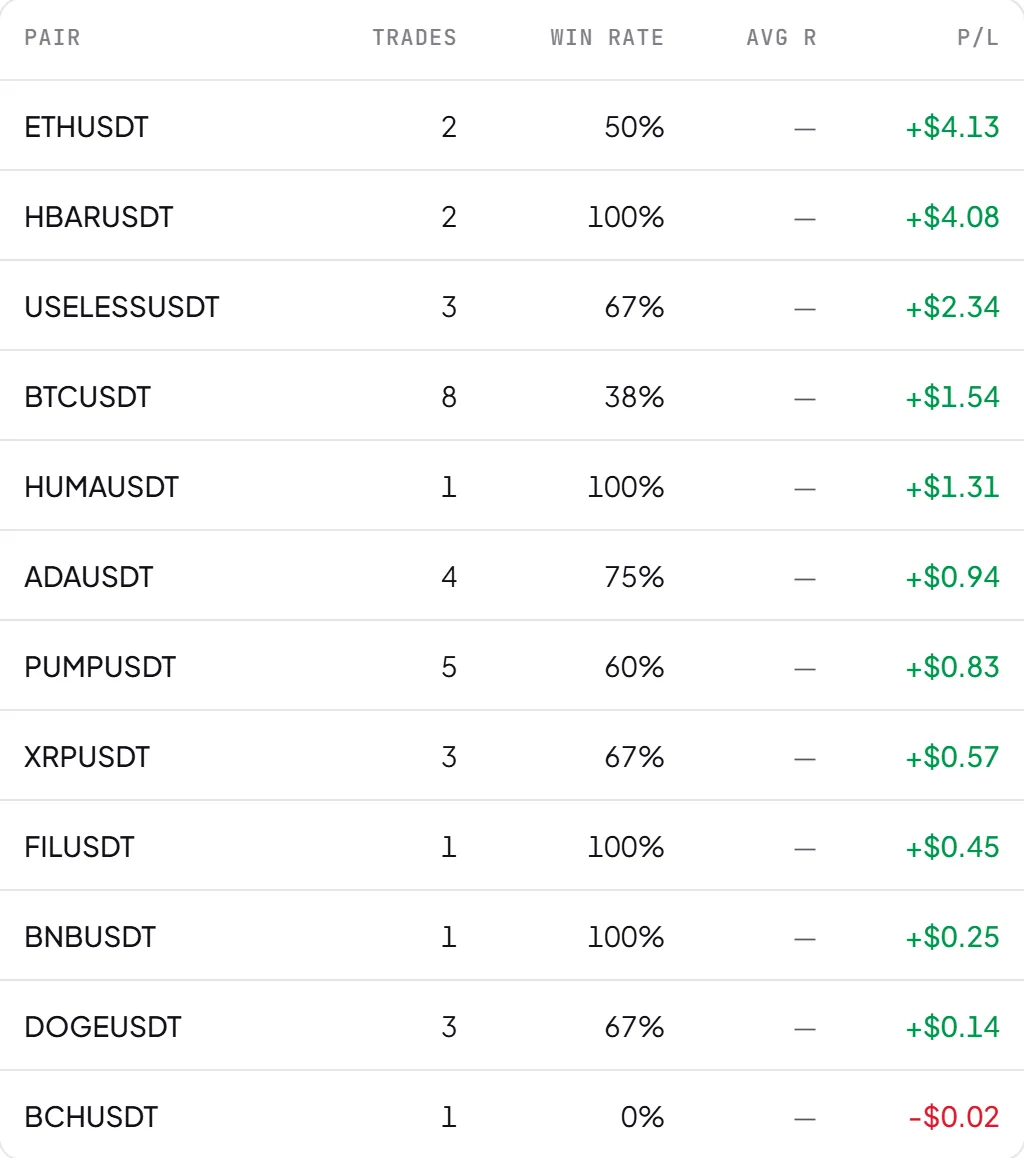
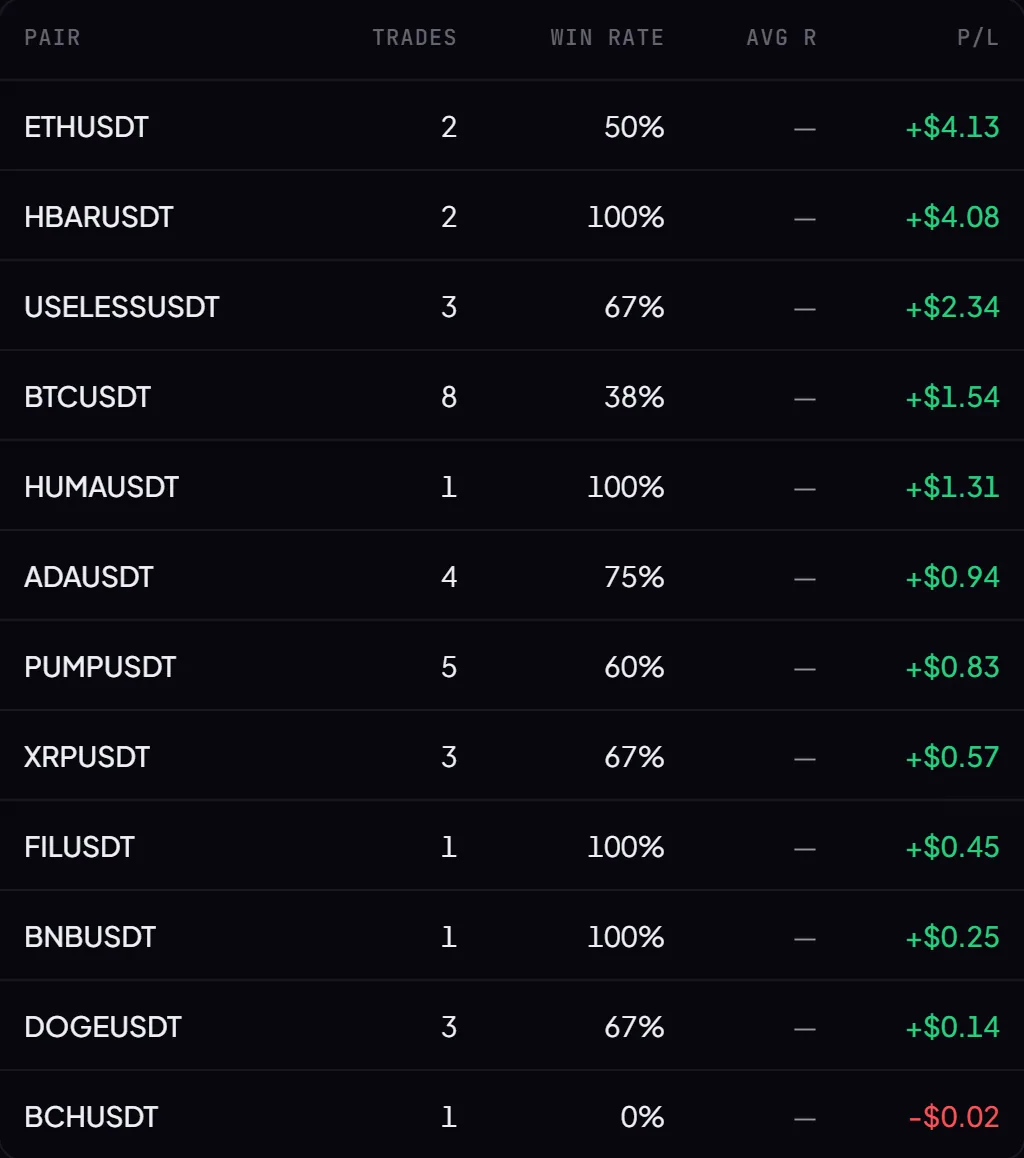
Totals hide the detail. Breakdowns split the same results by what you traded, how and when — so a profitable strategy carrying an unprofitable habit shows up as both.
By pair, strategy and more
Every dimension you record, measured.
Each breakdown shows P/L, trade count and win rate per group. Trades that don't record a dimension — leverage, say — are left out of it rather than lumped into a default.
What you traded
Strategy, pair, timeframe and exchange or account.
How you traded it
Long against short, leverage band, and isolated against cross margin.
When you traded it
Hour of day and day of week, in your own time zone.
Distribution and time
Consistency, not just the total.
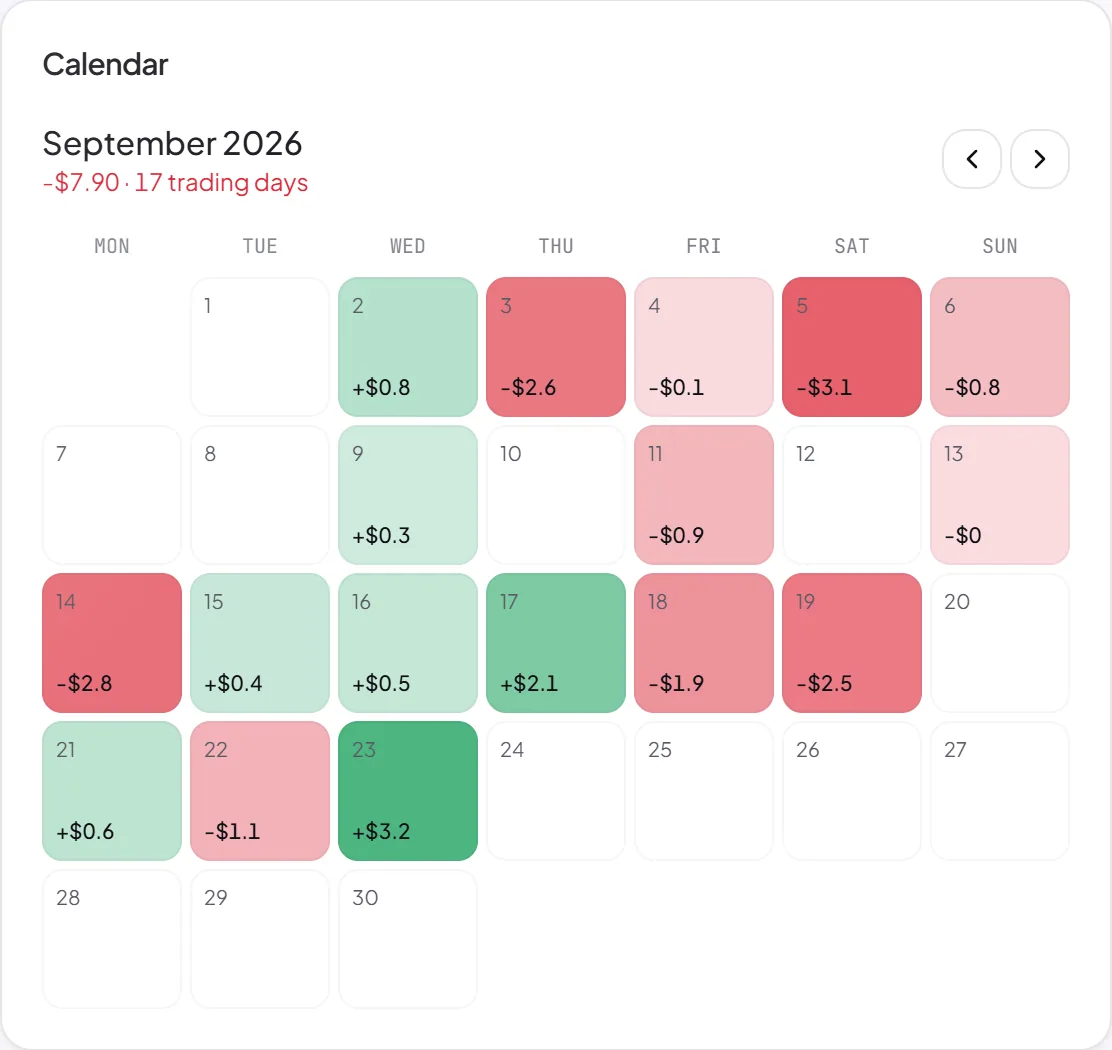
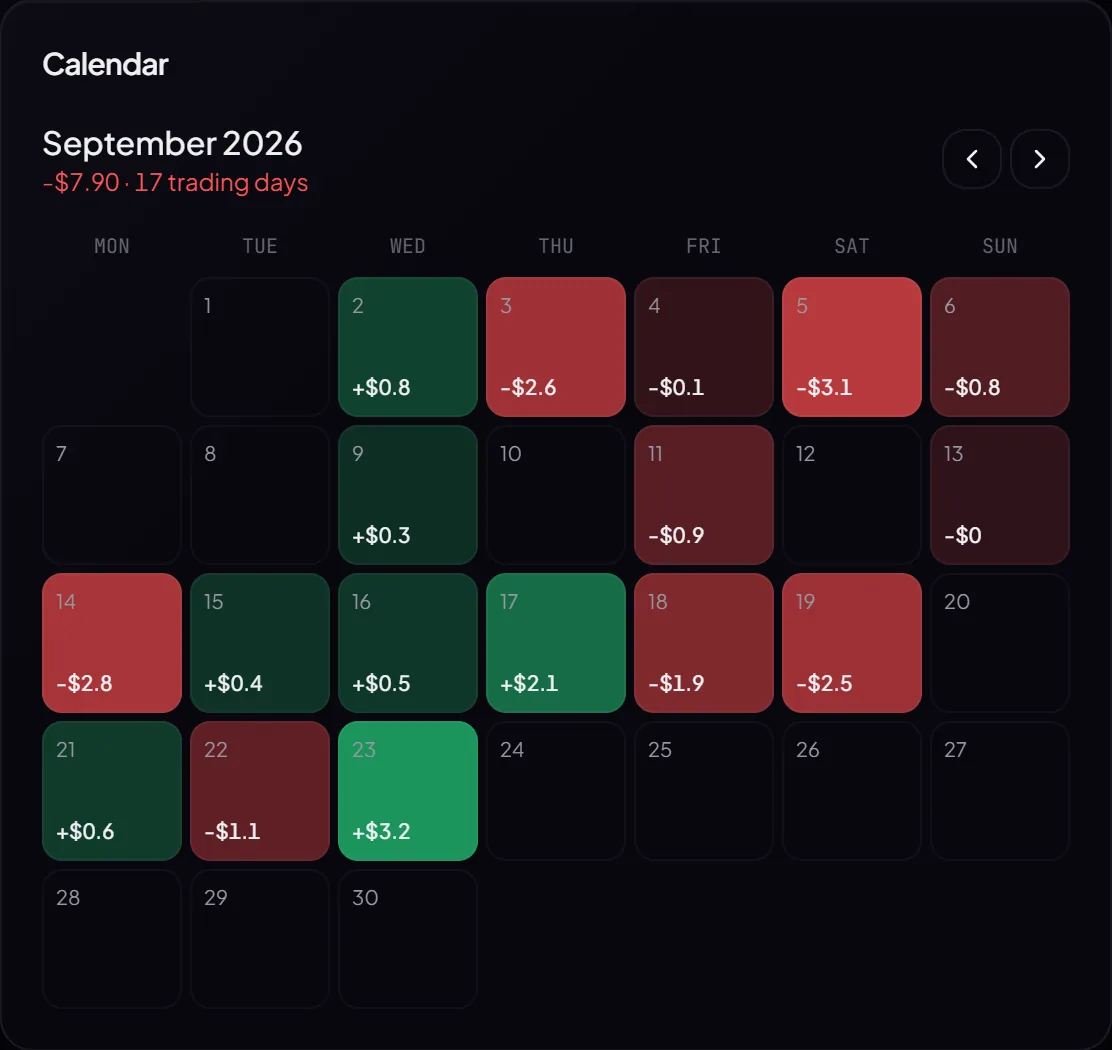
The equity curve, P/L by day, a calendar of daily results and the spread of R-multiples show whether results come steadily or from a handful of outliers.
Calendar
Each day's P/L, month by month.
Filters — Pro
Narrow everything to a date range, account, source, pair, side, strategy, timeframe, market, contract type or leverage.
03Review
Turn Insights Into Better Reviews.
Analytics shows what happened. The rest of PerpWick helps you decide what to do about it.
Reports — Pro
A full report, with the summary written out.
Reports expand Analytics into a complete review: risk, costs, sizing, trade management, long against short, time analysis and streaks, opened by a written summary of the period. Export any report to CSV.
Strategy Lab
Take a strategy that stands out in the breakdown and read its own results and rules.
Wick AI
Ask about a report's exact filters: why a period went the way it did, and what changed.
Your data
Export reports to CSV and your account data at any time.
Know What's Actually Working.
Record your trades and the summary, equity curve and core statistics follow on the Free plan. Pro adds the breakdowns, filters and reports.